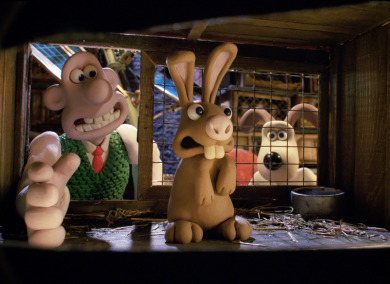
The Republic of The Curse of the Were-Rabbit
Vicar! I need more gold bullets!
Region: Suspicious
Quicksearch Query: The Curse of the Were-Rabbit
|
Quicksearch: | |
NS Economy Mobile Home |
Regions Search |
The Curse of the Were-Rabbit NS Page |
|
| GDP Leaders | Export Leaders | Interesting Places BIG Populations | Most Worked | | Militaristic States | Police States | |

Vicar! I need more gold bullets!
Region: Suspicious
Quicksearch Query: The Curse of the Were-Rabbit
| The Curse of the Were-Rabbit Domestic Statistics | |||
|---|---|---|---|
| Government Category: | Republic | ||
| Government Priority: | Law & Order | ||
| Economic Rating: | Good | ||
| Civil Rights Rating: | Good | ||
| Political Freedoms: | Good | ||
| Income Tax Rate: | 16% | ||
| Consumer Confidence Rate: | 101% | ||
| Worker Enthusiasm Rate: | 103% | ||
| Major Industry: | Pizza Delivery | ||
| National Animal: | were-rabbit | ||
| The Curse of the Were-Rabbit Demographics | |||
| Total Population: | 101,000,000 | ||
| Criminals: | 11,283,918 | ||
| Elderly, Disabled, & Retirees: | 13,976,521 | ||
| Military & Reserves: ? | 3,853,768 | ||
| Students and Youth: | 16,968,000 | ||
| Unemployed but Able: | 15,951,921 | ||
| Working Class: | 38,965,872 | ||
| The Curse of the Were-Rabbit Government Budget Details | |||
| Government Budget: | $217,054,506,312.01 | ||
| Government Expenditures: | $208,372,326,059.53 | ||
| Goverment Waste: | $8,682,180,252.48 | ||
| Goverment Efficiency: | 96% | ||
| The Curse of the Were-Rabbit Government Spending Breakdown: | |||
| Administration: | $20,837,232,605.95 | 10% | |
| Social Welfare: | $22,920,955,866.55 | 11% | |
| Healthcare: | $22,920,955,866.55 | 11% | |
| Education: | $20,837,232,605.95 | 10% | |
| Religion & Spirituality: | $6,251,169,781.79 | 3% | |
| Defense: | $31,255,848,908.93 | 15% | |
| Law & Order: | $31,255,848,908.93 | 15% | |
| Commerce: | $8,334,893,042.38 | 4% | |
| Public Transport: | $20,837,232,605.95 | 10% | |
| The Environment: | $8,334,893,042.38 | 4% | |
| Social Equality: | $10,418,616,302.98 | 5% | |
| The Curse of the Were-RabbitWhite Market Economic Statistics ? | |||
| Gross Domestic Product: | $181,093,000,000.00 | ||
| GDP Per Capita: | $1,793.00 | ||
| Average Salary Per Employee: | $3,142.60 | ||
| Unemployment Rate: | 24.29% | ||
| Consumption: | $662,328,484,823.04 | ||
| Exports: | $105,713,653,376.00 | ||
| Imports: | $107,761,352,704.00 | ||
| Trade Net: | -2,047,699,328.00 | ||
| The Curse of the Were-Rabbit Non Market Statistics ? Evasion, Black Market, Barter & Crime | |||
| Black & Grey Markets Combined: | $199,292,117,927.12 | ||
| Avg Annual Criminal's Income / Savings: ? | $1,471.80 | ||
| Recovered Product + Fines & Fees: | $22,420,363,266.80 | ||
| Black Market & Non Monetary Trade: | |||
| Guns & Weapons: | $7,939,330,887.32 | ||
| Drugs and Pharmaceuticals: | $8,821,478,763.68 | ||
| Extortion & Blackmail: | $7,057,183,010.95 | ||
| Counterfeit Goods: | $13,358,239,270.72 | ||
| Trafficking & Intl Sales: | $6,805,140,760.56 | ||
| Theft & Disappearance: | $8,065,352,012.51 | ||
| Counterfeit Currency & Instruments : | $16,382,746,275.41 | ||
| Illegal Mining, Logging, and Hunting : | $4,536,760,507.04 | ||
| Basic Necessitites : | $9,325,563,264.47 | ||
| School Loan Fraud : | $6,049,014,009.38 | ||
| Tax Evasion + Barter Trade : | $85,695,610,708.66 | ||
| The Curse of the Were-Rabbit Total Market Statistics ? | |||
| National Currency: | carrot | ||
| Exchange Rates: | 1 carrot = $0.18 | ||
| $1 = 5.48 carrots | |||
| Regional Exchange Rates | |||
| Gross Domestic Product: | $181,093,000,000.00 - 48% | ||
| Black & Grey Markets Combined: | $199,292,117,927.12 - 52% | ||
| Real Total Economy: | $380,385,117,927.12 | ||
| Suspicious Economic Statistics & Links | |||
| Gross Regional Product: | $336,902,560,457,687,040 | ||
| Region Wide Imports: | $45,169,080,130,338,816 | ||
| Largest Regional GDP: | Sparkdottir | ||
| Largest Regional Importer: | Sparkdottir | ||
| Regional Search Functions: | All Suspicious Nations. | ||
| Regional Nations by GDP | Regional Trading Leaders | |||
| Regional Exchange Rates | WA Members | |||
| Returns to standard Version: | FAQ | About | About | 483,374,857 uses since September 1, 2011. | |
Version 3.69 HTML4. V 0.7 is HTML1. |
Like our Calculator? Tell your friends for us... |